30 days
Cash and orders
The near window. Receipts, payroll, VAT and the orders that will or will not land before month end. Used by treasury and the weekly trading meeting.
AI-driven financial forecasting · United Kingdom
Acrisiaorix is a Bridgend studio that turns ledgers, order books and the British calendar into a range your finance team can use. Models propose a path. People publish it.
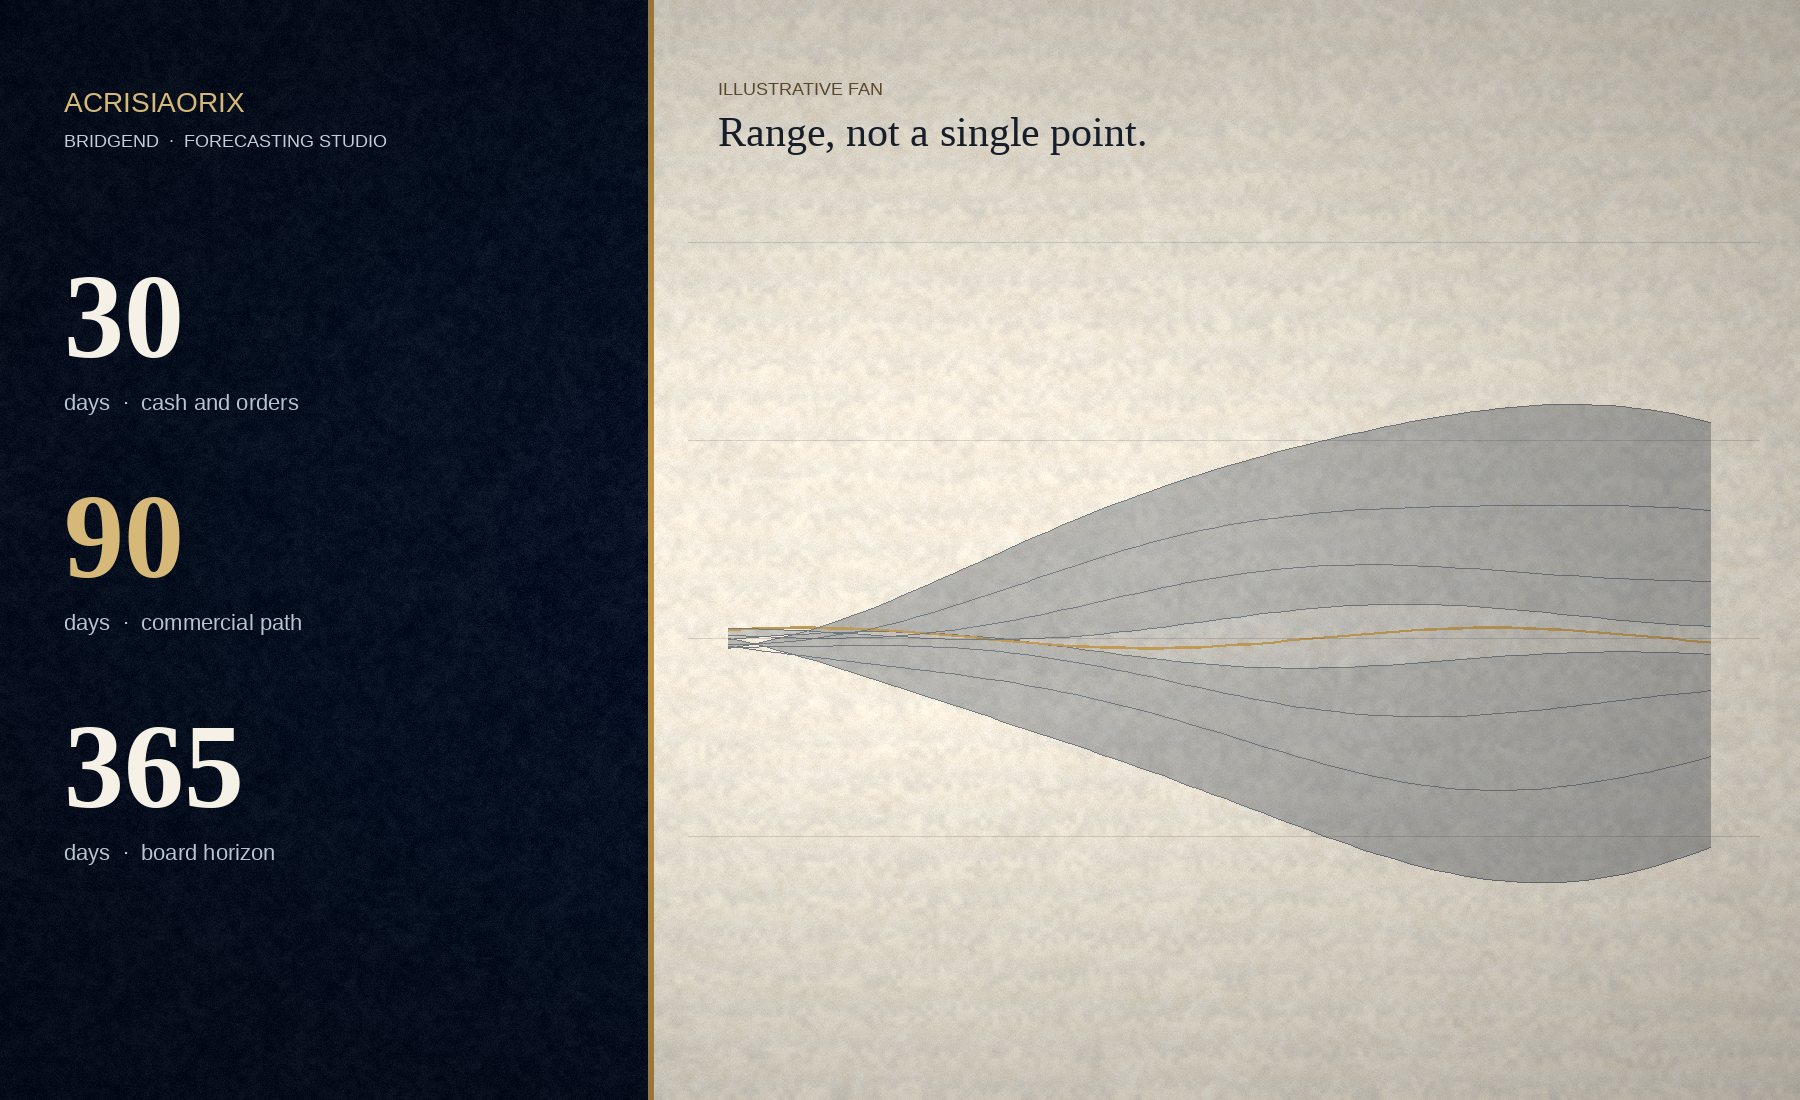
30 days
The near window. Receipts, payroll, VAT and the orders that will or will not land before month end. Used by treasury and the weekly trading meeting.
90 days
Where pipeline, price, mix and seasonality actually meet. The range a commercial director can resource against without pretending the midpoint is fate.
365 days
A year of shape, not a year of false precision. Hiring, stock, facilities and the rate path, written so a board can see what would change the story.
Four artefacts. No dashboard that only the person who built it can read.

Every release shows a base path, a stress path and an upside path, with the band between them drawn from the model’s recent error — not from a mood. The midpoint is labelled as a midpoint.
Two pages. What moved, what we overrode, and which assumption the forecast is hostage to. If the note cannot be written in plain English, the release waits.
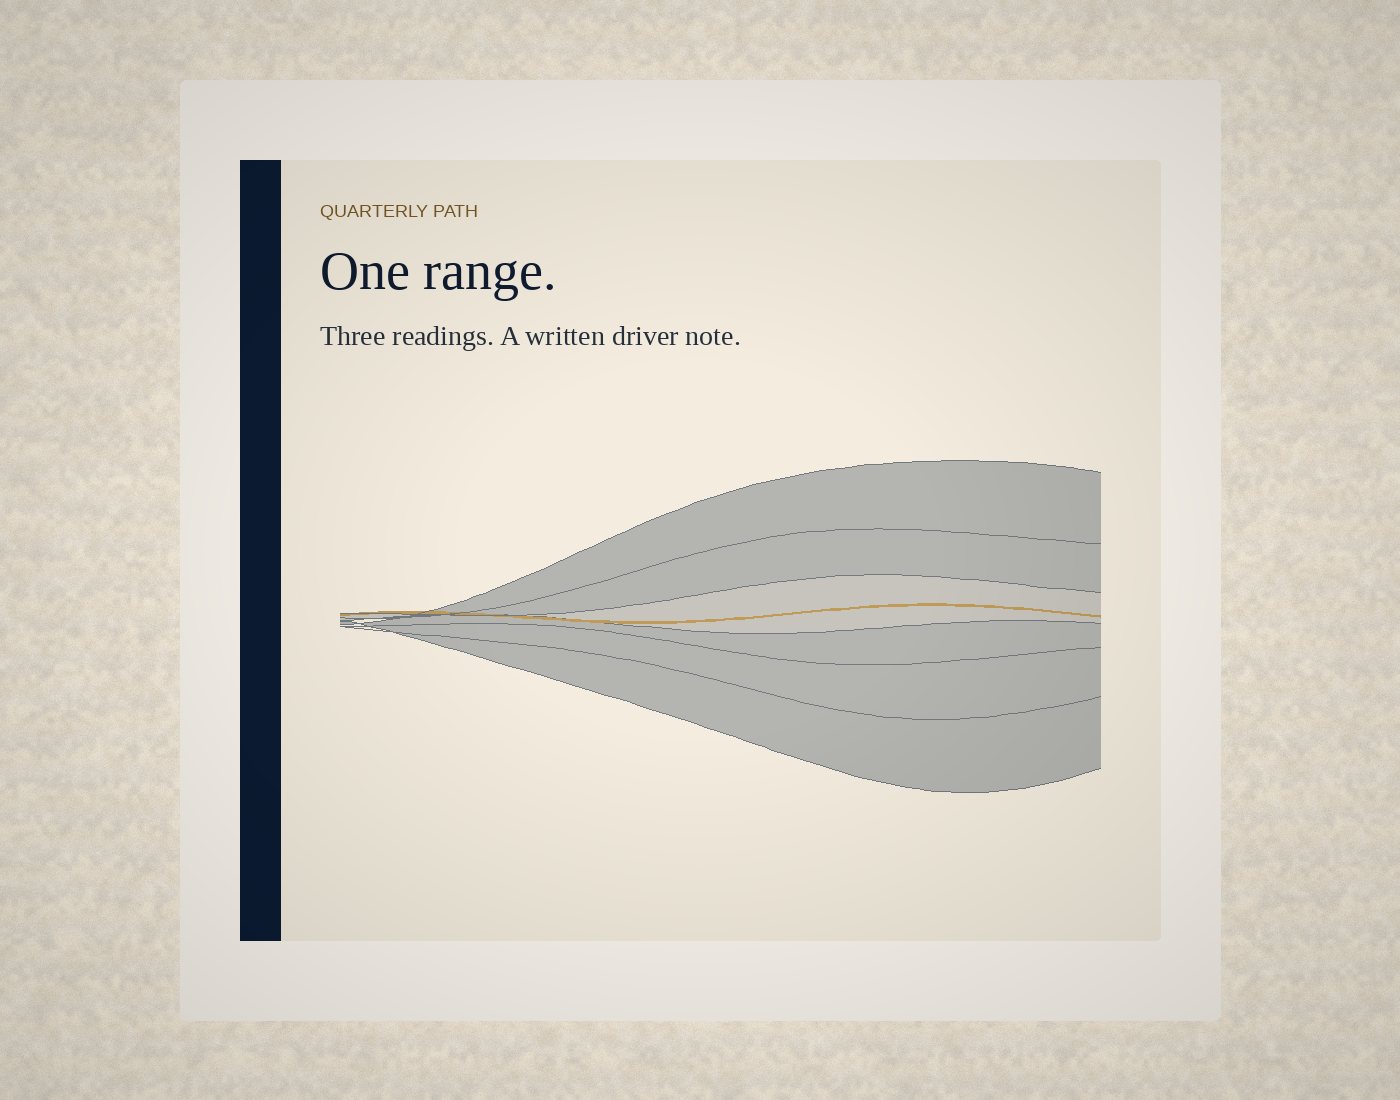
The choices the range was built to inform: stock cover, a hiring gate, a covenant conversation. We record the decision you took, so next month’s error has a context.
Same skeleton, new actuals. We show the bridge from last month’s fan to this month’s, so the board sees revision rather than a brand new story.
A person at Acrisiaorix signs the pack. The model does not email the board on its own. Overrides are dated and kept.
Sample path · not a client result
Turnover of £18 million, South Wales, selling machined parts into UK assembly lines. The indices below are a teaching sketch of how we present a range. They are not this firm’s forecast, not a market call, and not a promise that any engagement will look like this.
Base reading
Index = 100 at today. Figures are rounded illustrations for this page only.
Most finance teams already have a forecast. It lives in a workbook with one column called “likely”. The argument in the room is then about whether someone is being optimistic. We would rather give you a range with the argument already attached.

Order-book lag, metal lead times, and a Friday payroll that does not care about a late call-off.
Promotions, short shelf life, and the weeks the British retail year actually bends.
Like-for-like by format, not a single chain average that hides a weak cohort of shops.
Utilisation, delayed billing, and revenue that is real only when the work is done.
Service-charge cycles, void risk, and maintenance that arrives in clumps.
Applications for payment, retentions, and the gap between certified value and cash.

The studio is at 31 St Winifred’s Rd, Bridgend CF31 4PL. Clients are finance teams who want a standing forecast, not a one-off model they cannot rerun in March.